
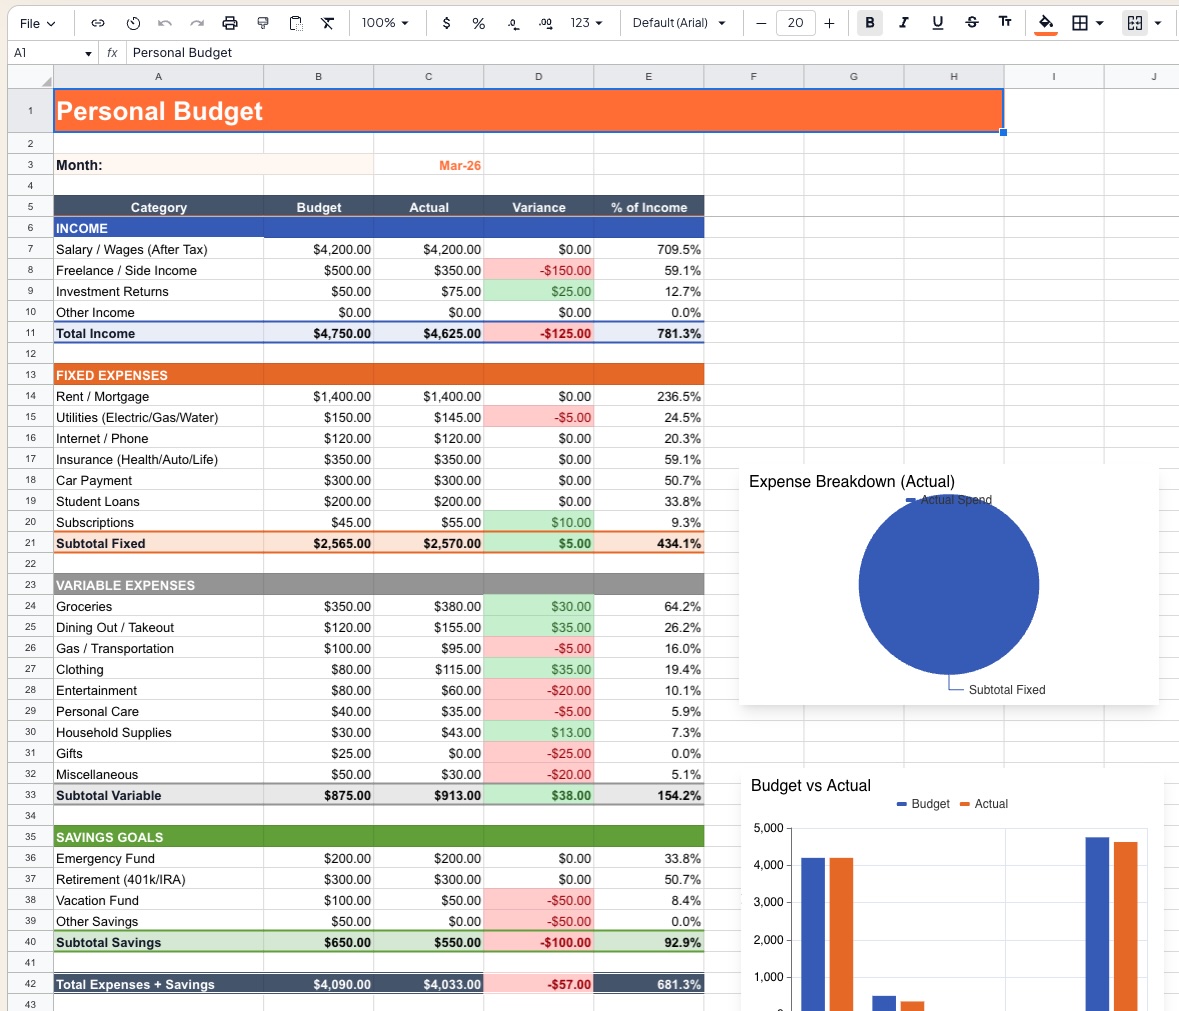
About Personal Budget Template
This Personal Budget Template gives you a complete month-by-month view of your financial health. Enter your budgeted amounts once, record actuals as the month progresses, and instantly see where you are over or under budget across every spending category. Variance highlighting, % of income columns, and built-in charts make it easy to spot problem areas and stay on track toward your savings goals.
Suitable for individuals and couples managing household finances, anyone building a budget for the first time, people tracking spending to pay off debt or build savings, and those planning for a major financial goal such as a home purchase or retirement.
Model Architecture
| Sheet | Purpose |
|---|---|
Monthly Budget | Primary input and tracking sheet — income, expenses, savings, variance |
Annual Summary | 12-month rollup of actuals, totals, and trends by category |
Savings Goals | Goal tracker with target amounts, deadlines, and progress bars |
Net Worth | Assets vs. liabilities snapshot updated monthly |
Charts | Expense breakdown, budget vs. actual, and monthly trend visuals |
Monthly Budget Sheet
Header
| Field | Example | Description |
|---|---|---|
| Month | Mar-26 | Month being budgeted — drives all period labels |
Column Structure
All sections share the same five-column layout:
| Column | Description |
|---|---|
| Category | Income source or expense line item |
| Budget | Planned amount for the month |
| Actual | Amount actually received or spent |
| Variance | Actual − Budget (auto-calculated) |
| % of Income | Category amount as a percentage of Total Income |
Section 1 — Income
| Line Item | Description |
|---|---|
| Salary / Wages (After Tax) | Primary take-home pay |
| Freelance / Side Income | Gig work, consulting, or secondary employment |
| Investment Returns | Dividends, interest, rental income |
| Other Income | One-off receipts, gifts, tax refunds |
| Total Income | Sum of all income lines |
Section 2 — Fixed Expenses
Recurring obligations that do not change month to month:
| Line Item | Description |
|---|---|
| Rent / Mortgage | Housing payment |
| Utilities (Electric/Gas/Water) | Essential services |
| Internet / Phone | Telecommunications |
| Insurance (Health/Auto/Life) | Premium payments |
| Car Payment | Auto loan installment |
| Student Loans | Education debt repayment |
| Subscriptions | Streaming, software, memberships |
| Subtotal Fixed | Sum of all fixed expense lines |
Section 3 — Variable Expenses
Discretionary and fluctuating spending categories:
| Line Item | Description |
|---|---|
| Groceries | Supermarket and food essentials |
| Dining Out / Takeout | Restaurants, delivery, coffee |
| Gas / Transportation | Fuel, public transit, ride-hailing |
| Clothing | Apparel and footwear |
| Entertainment | Events, cinema, hobbies |
| Personal Care | Haircuts, toiletries, pharmacy |
| Household Supplies | Cleaning products, home items |
| Gifts | Birthdays, occasions, donations |
| Miscellaneous | Unplanned or uncategorized spending |
| Subtotal Variable | Sum of all variable expense lines |
Section 4 — Savings Goals
Intentional savings allocated before discretionary spending:
| Line Item | Description |
|---|---|
| Emergency Fund | 3–6 month expense buffer |
| Retirement (401k / IRA / CPF) | Long-term retirement contributions |
| Vacation Fund | Travel savings |
| Other Savings | House deposit, education, or custom goal |
| Subtotal Savings | Total savings allocated this month |
Summary Row
| Output | Description |
|---|---|
| Total Expenses + Savings | Fixed + Variable + Savings subtotals |
| Net Surplus / Deficit | Total Income − Total Expenses & Savings |
A positive net surplus means more money came in than went out. A negative figure (highlighted in red) signals overspending or a shortfall in income for the month.
Variance Formatting
Color-coded variance cells for instant visual feedback:
| Color | Meaning |
|---|---|
| 🟢 Green | Favorable — spent less than budgeted (expenses) or earned more (income) |
| 🔴 Red / Pink | Unfavorable — overspent vs. budget or earned less than expected |
| ⚫ Black / Zero | On budget — no variance |
% of Income Column
Every line item displays its amount as a percentage of Total Income — a powerful perspective that reveals the true weight of each expense in your financial picture. Common benchmarks:
| Category | Suggested % of Income |
|---|---|
| Housing (Rent/Mortgage) | ≤ 30% |
| Food (Groceries + Dining) | ≤ 15% |
| Transportation | ≤ 10% |
| Savings | ≥ 20% |
| Entertainment & Lifestyle | ≤ 10% |
Charts
Expense Breakdown (Actual)
A donut or pie chart showing actual spending split across Fixed Expenses, Variable Expenses, and Savings — giving a proportional view of where money went this month.
Budget vs. Actual
A grouped bar chart comparing budgeted vs. actual amounts for each major section (Income, Fixed, Variable, Savings) — making over and underspending immediately visible.
Monthly Trend (Annual Summary Sheet)
A line chart tracking Total Income, Total Expenses, and Net Surplus month by month across the full year — revealing seasonal patterns and progress over time.
Annual Summary Sheet
A 12-column rollup (Jan–Dec) showing actuals for every budget line item, enabling year-end review:
| Output | Description |
|---|---|
| Monthly Actuals Grid | Each category × each month |
| Annual Total | Sum of actuals for the full year per category |
| Annual Average | Monthly average per category |
| Best Month | Month with lowest spending in each category |
| Worst Month | Month with highest spending in each category |
Savings Goals Tracker
| Field | Description |
|---|---|
| Goal Name | Emergency Fund, House Deposit, Vacation, etc. |
| Target Amount | Total amount needed |
| Target Date | Deadline for reaching the goal |
| Amount Saved to Date | Running balance |
| Monthly Contribution | Regular allocation from budget |
| Months Remaining | Auto-calculated from target and contribution rate |
| Progress Bar | Visual fill showing % of goal achieved |
Formatting Conventions
- 🔵 Blue font — user-editable input cells (Budget and Actual columns)
- ⚫ Black font — auto-calculated outputs (Variance, % of Income, subtotals)
- 🟠 Orange header band — sheet title (Personal Budget)
- 🔵 Blue section bands — Income and Fixed Expenses section headers
- 🟠 Orange section band — Variable Expenses section header
- 🟢 Green section band — Savings Goals section header
- Bold subtotal rows — Subtotal Fixed, Subtotal Variable, Subtotal Savings, Total Income
- Print area optimized for A4 portrait — full monthly view on one page
How to Use
- Set the Month field at the top to the current month
- Enter your expected Budget amounts for all income and expense categories
- As the month progresses, record Actual amounts received or spent
- Review the Variance column and color highlights to identify problem areas
- Check % of Income column against benchmark ratios
- At month end, verify the Net Surplus / Deficit row
- Review the Annual Summary sheet to track trends across the year
- Update the Savings Goals tracker with contributions made
Requirements
- Microsoft Excel 2016+ or Excel 365 (Windows or Mac)
- No macros required — fully formula-based
- Compatible with Google Sheets
- Conditional formatting required for variance color-coding
Limitations & Caveats
This template tracks one person or household's monthly budget. It is a planning and tracking tool, not a bank feed or accounting system.
- Transactions are entered manually — no bank or card feed integration
- Does not track individual transactions, only category-level totals
- Tax calculations, CPF contributions, and statutory deductions are not modeled
- Joint budgets with split income require manual aggregation of both partners' figures
Changelog
| Version | Date | Notes |
|---|---|---|
| v1.0 | Jan 2024 | Initial release — monthly budget and variance tracking |
| v1.5 | Jul 2024 | Added Annual Summary, Savings Goals tracker, charts |
| v2.0 | Apr 2026 | Net Worth sheet, % of Income column, benchmark formatting, donut chart |