About DCF Model
This DCF model template provides a structured, assumption-driven framework for estimating the intrinsic value of a business by projecting future free cash flows and discounting them back to the present at a risk-adjusted rate. Built for analysts, investors, and founders who need a rigorous yet flexible valuation tool.
Suitable for equity research and investment analysis, M&A due diligence, startup and growth company valuation, and sensitivity testing and scenario modeling.
Model Architecture
The template is organized across 7 interconnected sheets, each serving a distinct analytical purpose:
| Sheet | Purpose |
|---|---|
Dashboard | High-level valuation summary, implied share price, and key output metrics |
Assumptions | Central input hub — all driver assumptions live here |
Income Statement | Projected P&L built from revenue down to NOPAT |
Balance Sheet | Working capital schedules and asset forecasting |
Cash Flow | Unlevered free cash flow (UFCF) build |
WACC | Weighted average cost of capital computation |
Sensitivity | Two-variable data tables for price and IRR sensitivity |
Key Features
Projection Engine
- 5–10 year explicit forecast period with configurable start year
- Revenue modeled via growth rate or bottom-up segment build
- EBITDA margin expansion or compression assumptions by year
- D&A, capex, and working capital as % of revenue or absolute inputs
Free Cash Flow Build
Starting from Revenue, subtract Cost of Revenue to get Gross Profit. Subtract Operating Expenses to get EBIT. Apply taxes on EBIT to arrive at NOPAT. Add back D&A, subtract Capex and the change in Working Capital to arrive at Unlevered Free Cash Flow (UFCF).
Terminal Value
Choose between two methodologies via dropdown: the Gordon Growth Model — Terminal FCF × (1 + g) / (WACC – g) — or an Exit Multiple approach using Terminal EBITDA × a user-defined EV/EBITDA multiple.
WACC Calculator
- Risk-free rate linked to 10Y Treasury input
- Equity risk premium with Damodaran-style country and industry adjustment
- Beta — raw, levered, or unlevered re-levered to target capital structure
- Cost of debt and effective tax rate
- Capital structure weights (market-value or target)
Valuation Bridge
Enterprise Value (PV of FCFs + Terminal Value), less Net Debt, less Minority Interest, plus Investments & Associates = Equity Value. Divided by diluted shares outstanding = Implied Share Price.
Sensitivity Analysis
Pre-built two-variable sensitivity tables showing implied share price across WACC × Terminal Growth Rate, WACC × Exit EV/EBITDA Multiple, and Revenue CAGR × EBITDA Margin. Color-coded heatmaps highlight upside, base, and downside ranges automatically via conditional formatting.
Inputs & Assumptions
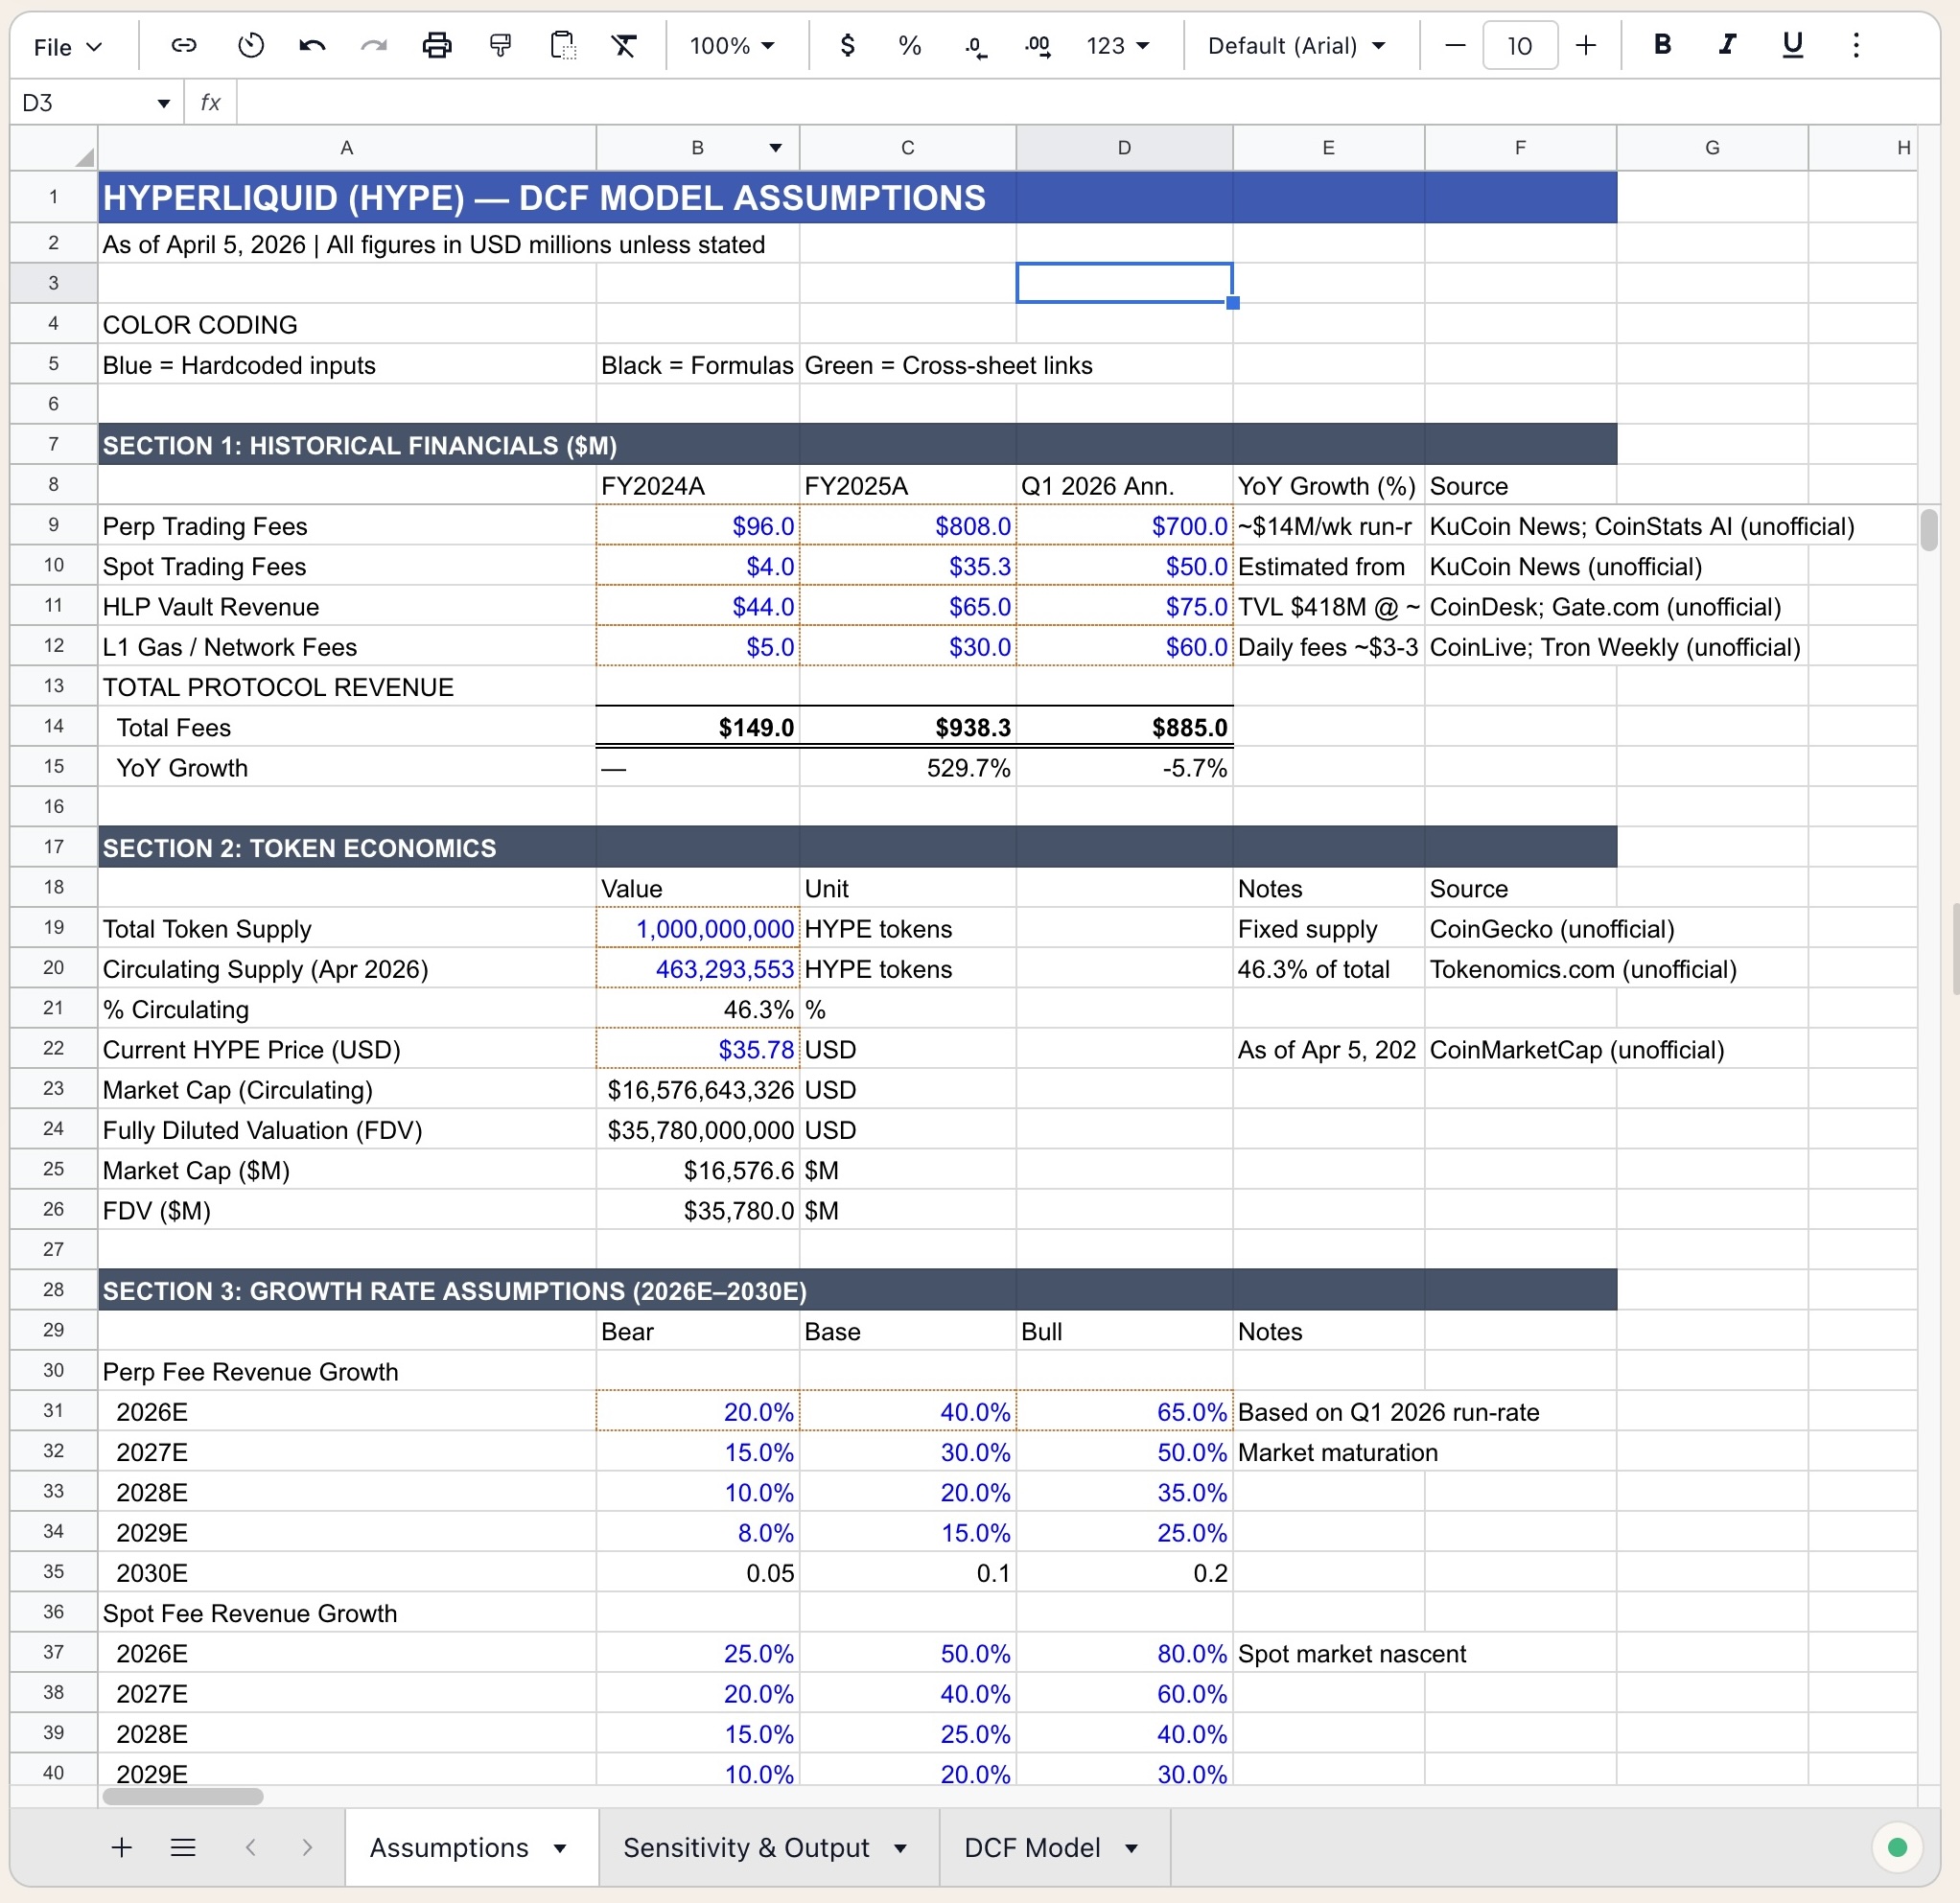
All assumptions are centralized in the Assumptions tab. No hardcoded values exist in formula cells — the model is fully assumption-driven.
Operating Assumptions
| Input | Description |
|---|---|
| Revenue (Year 0) | Base year actuals or LTM revenue |
| Revenue Growth Rate | YoY % by year, or CAGR with straight-line interpolation |
| Gross Margin % | Stable or expanding/contracting by year |
| EBITDA Margin % | Target or trended |
| D&A % of Revenue | Depreciation & amortization proxy |
| Capex % of Revenue | Maintenance + growth capex |
| NWC % of Revenue | Net working capital intensity |
| Tax Rate | Effective statutory or blended |
Discount Rate Inputs
| Input | Description |
|---|---|
| Risk-Free Rate | 10Y government bond yield |
| Equity Risk Premium | Market-implied or historical |
| Beta | Industry or company-specific |
| Pre-Tax Cost of Debt | Yield on existing / new debt |
| Target D/E Ratio | Capital structure assumption |
Scenarios
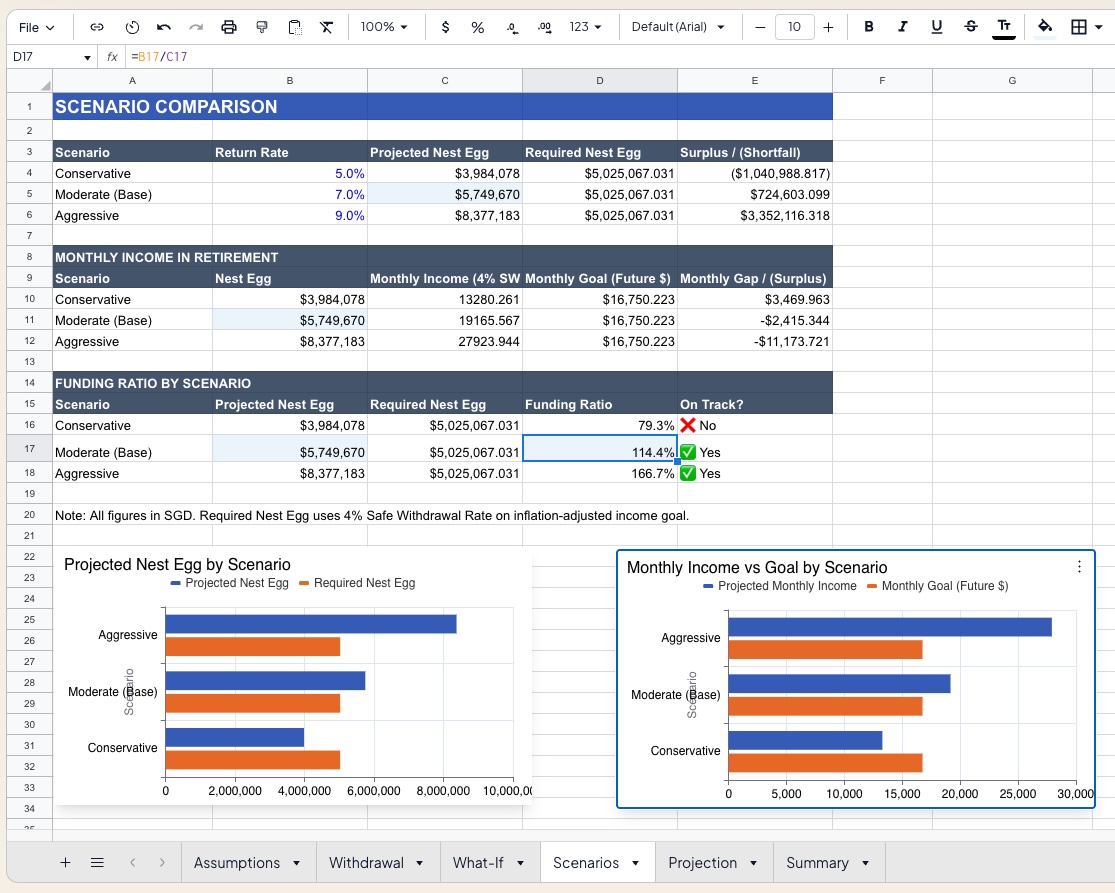
Three pre-built scenarios selectable from a dropdown: a Bull Case (above-trend growth, margin expansion, low WACC), a Base Case (consensus estimates, stable margins), and a Bear Case (slower growth, margin compression, higher risk premium). Each scenario auto-populates the Assumptions sheet and recalculates the full model dynamically.
Formatting Conventions
The model follows standard financial modeling best practices: blue font for hard-coded inputs (only in the Assumptions sheet), black font for formulas and calculated outputs, and green shading for output/result cells. The model contains no circular references — interest is computed on beginning-of-period debt.
Requirements
- Microsoft Excel 2016+ or Excel 365 (Windows or Mac)
- Macros not required — fully formula-based
- Compatible with Google Sheets with minor adjustments (data tables require Excel)
Limitations & Caveats
A DCF is only as good as its assumptions. Garbage in, garbage out.
Terminal value typically represents 60–80% of total enterprise value — treat it with appropriate skepticism. The model assumes a going concern and does not model distress or bankruptcy scenarios. Working capital modeling is simplified; complex businesses (e.g., financial institutions, real estate) require sector-specific adjustments. All projections are nominal unless the user modifies the revenue build.
Changelog
| Version | Date | Notes |
|---|---|---|
| v1.0 | Jan 2024 | Initial release |
| v1.5 | Apr 2024 | Added exit multiple toggle, scenario engine |
| v2.0 | Jan 2025 | Rebuilt WACC tab, added 3-table sensitivity, heatmap formatting |