About Retirement Calculator
This Retirement Calculator models the complete arc of your financial life — from today's savings through your final year of retirement. Enter your personal details, current finances, and return assumptions once, and the template projects whether your nest egg will last as long as you need it to, how much you need to save, and what income you can sustainably draw in retirement.
Suitable for individuals planning for early or traditional retirement, financial advisors building client retirement projections, couples modeling joint retirement timelines, and anyone stress-testing their savings rate against income goals.
Model Architecture
The template is organized across 6 interconnected sheets:
| Sheet | Purpose |
|---|---|
Assumptions | Central input hub — all personal, financial, and return parameters |
Projection | Year-by-year portfolio growth through accumulation and drawdown phases |
Withdrawal | Sustainable withdrawal modeling using the 4% rule or custom rate |
What-If | Single-variable sensitivity toggles for quick scenario testing |
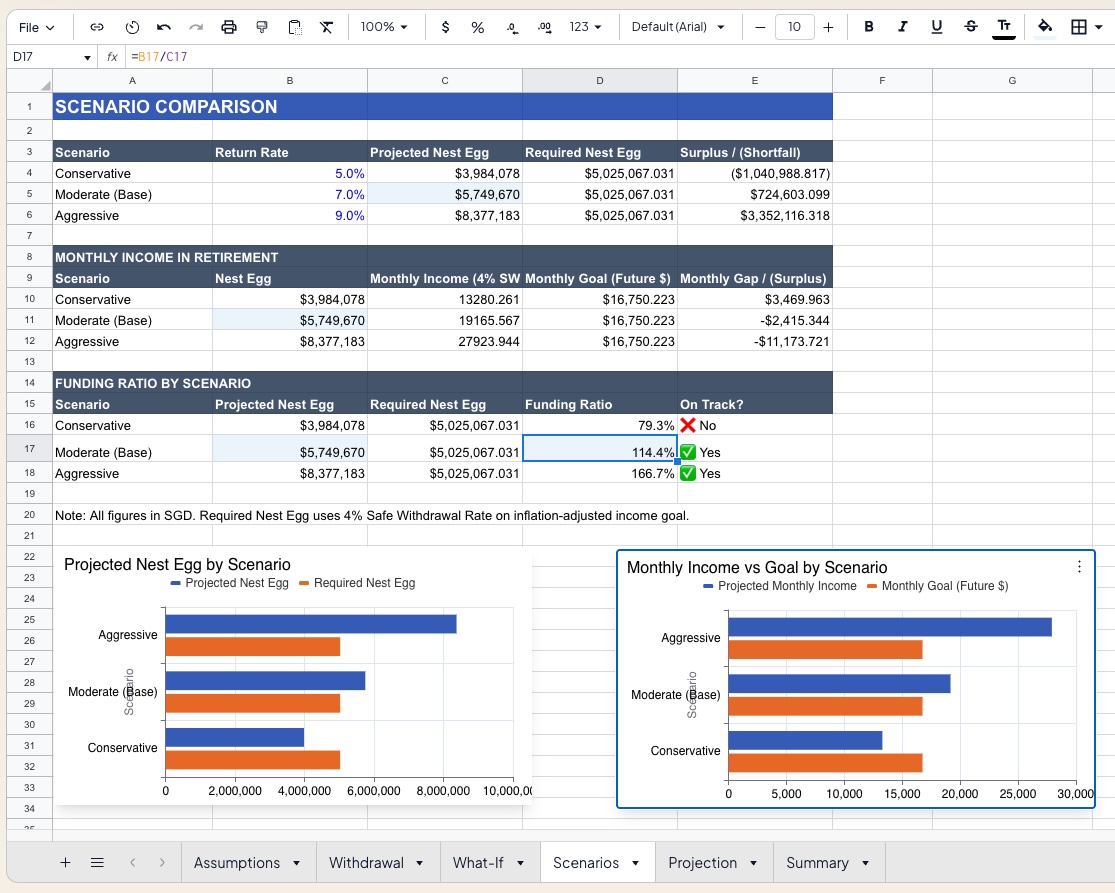
Scenarios | Side-by-side comparison of Bull, Base, and Bear retirement outcomes |
Summary | One-page dashboard with key outputs, gap analysis, and readiness score |
Assumptions Sheet
All inputs are centralized here. Organized into five panels:
Personal Details
| Input | Example | Description |
|---|---|---|
| Current Age | 40 years | Age today |
| Retirement Age | 65 years | Planned retirement date |
| Years to Retirement | 25 years | Auto-calculated from above |
| Life Expectancy | 90 years | Planning horizon end point |
| Years in Retirement | 25 years | Auto-calculated drawdown period |
Current Finances
| Input | Example | Description |
|---|---|---|
| Current Retirement Savings | $500,000 SGD | Existing investable assets |
| Monthly Contribution | $4,000 SGD/month | Regular savings going forward |
| Annual Contribution | $48,000 SGD/year | Auto-calculated from monthly input |
Return & Inflation Assumptions
| Input | Example | Description |
|---|---|---|
| Annual Investment Return | 7.0% | Nominal portfolio return (moderate scenario) |
| Annual Inflation Rate | 3.0% | Long-run CPI assumption |
| Real Return (after inflation) | 3.9% | Auto-calculated: (1+r)/(1+i) − 1 |
Retirement Income Goal
| Output | Example | Description |
|---|---|---|
| Monthly Income Goal (Today's $) | $8,000 SGD/month | Target lifestyle expense in today's dollars |
| Annual Income Goal (Today's $) | $96,000 SGD/year | Auto-calculated |
| Monthly Income Goal (Future $) | $16,750 SGD/month | Inflation-adjusted to retirement date |
| Annual Income Goal (Future $) | $201,003 SGD/year | Auto-calculated |
Nest Egg Calculation
| Output | Example | Description |
|---|---|---|
| Safe Withdrawal Rate | 4.0% | The 4% rule (configurable) |
| Required Nest Egg (Today's $) | $2,400,000 SGD | Income Goal ÷ Safe Withdrawal Rate |
| Required Nest Egg (Future $) | $5,025,067 SGD | Inflation-adjusted target at retirement |
| Projected Nest Egg at Retirement | $5,749,670 SGD | FV of current savings + FV of contributions |
A surplus or shortfall is automatically flagged — green if the projected nest egg exceeds the required amount, red if a savings gap exists.
Projection Sheet
A full year-by-year table from current age through life expectancy, split into two phases:
Accumulation Phase (Working Years)
| Column | Description |
|---|---|
| Age / Year | Calendar year and age |
| Opening Balance | Portfolio value at start of year |
| Annual Contribution | Savings added during the year |
| Investment Return | Portfolio growth at assumed return rate |
| Closing Balance | End-of-year portfolio value |
| Inflation-Adjusted Balance | Real purchasing power of the portfolio |
Drawdown Phase (Retirement Years)
| Column | Description |
|---|---|
| Age / Year | Retirement year number |
| Opening Balance | Portfolio at start of year |
| Annual Withdrawal | Income drawn (inflation-adjusted each year) |
| Investment Return | Remaining portfolio continues to compound |
| Closing Balance | Remaining balance after withdrawal |
| Portfolio Depleted? | Flag if balance hits zero before life expectancy |
Withdrawal Sheet
Models sustainable income under different withdrawal frameworks:
| Method | Description |
|---|---|
| 4% Rule | Fixed percentage of initial portfolio, inflation-adjusted annually |
| Fixed Dollar | Constant nominal withdrawal regardless of portfolio performance |
| Dynamic / Guardrails | Adjusts withdrawals up or down based on portfolio performance bands |
Outputs include the maximum sustainable annual income, year of portfolio depletion under each method, and a comparison table showing the trade-off between income level and longevity of funds.
What-If Sheet
Quick single-variable sensitivity toggles — change one assumption and see the immediate impact on projected nest egg and retirement income:
- What if I retire 3 years earlier or later?
- What if my return is 5% instead of 7%?
- What if inflation runs at 4%?
- What if I increase my monthly contribution by $500?
- What if I live to 95 instead of 90?
Each toggle recalculates the projected nest egg, surplus/shortfall, and years until portfolio depletion.
Scenarios Sheet
Three pre-built scenarios compared side by side:
| Scenario | Return Assumption | Inflation | Notes |
|---|---|---|---|
| 🟢 Bull Case | 9.0% | 2.5% | Strong market, low inflation |
| 🟡 Base Case | 7.0% | 3.0% | Moderate — consensus long-run assumptions |
| 🔴 Bear Case | 5.0% | 3.5% | Subdued returns, elevated inflation |
Each scenario shows final nest egg, income sustainable, surplus or shortfall vs. target, and age at which portfolio is depleted if underfunded.
Summary Dashboard
A single-page retirement readiness overview:
- Projected Nest Egg vs. Required Nest Egg — visual gap bar
- Years of Income Funded — how many years the portfolio sustains withdrawals
- Monthly Income Available — what the projected nest egg can sustainably pay
- Savings Rate Check — current annual contribution as % of gross income
- On Track Indicator — simple green / amber / red readiness signal
- Key Milestones — age at which portfolio hits $1M, $2M, $5M thresholds
Key Formula Reference
Future Value of Current Savings
FV = PV × (1 + r)^n
Future Value of Regular Contributions
FV = PMT × [((1 + r)^n − 1) / r]
Required Nest Egg (4% Rule)
Nest Egg = Annual Income Goal ÷ Safe Withdrawal Rate
Real Return
Real Return = (1 + Nominal Return) / (1 + Inflation) − 1
Inflation-Adjusted Future Income Goal
Future Goal = Today's Goal × (1 + Inflation)^Years to Retirement
Formatting Conventions
- 🔵 Blue font — user-editable input cells
- ⚫ Black font — formula-driven outputs
- 🟢 Green highlight — surplus, on-track status, funded years
- 🔴 Red highlight — shortfall, portfolio depletion risk
- Dark navy header bands — section titles throughout
- All currency values displayed in SGD (configurable to any currency)
- Percentage inputs formatted to 1 decimal place
Requirements
- Microsoft Excel 2016+ or Excel 365 (Windows or Mac)
- No macros required — fully formula-based
- Compatible with Google Sheets with minor adjustments
- Print-ready Summary sheet for advisor or client meetings
Limitations & Caveats
Returns are modeled at a constant nominal rate. Real investment returns vary year to year — this model assumes smooth compounding and does not simulate sequence-of-returns risk.
- CPF (Central Provident Fund) balances and payouts are not modeled — add as a separate income stream in the Withdrawal sheet
- Tax on investment income and capital gains not deducted
- Does not model joint/spousal retirement or survivor income needs
- Healthcare cost inflation (typically higher than CPI) is not separately modeled
- Sequence-of-returns risk — a market downturn early in retirement can significantly accelerate depletion beyond what this model shows
Changelog
| Version | Date | Notes |
|---|---|---|
| v1.0 | Apr 2024 | Initial release — Assumptions and Projection sheets |
| v1.5 | Sep 2024 | Added Withdrawal methods, What-If toggles |
| v2.0 | Apr 2026 | Scenarios tab, Summary dashboard, SGD currency, depletion flag |