About Loan Calculator Template
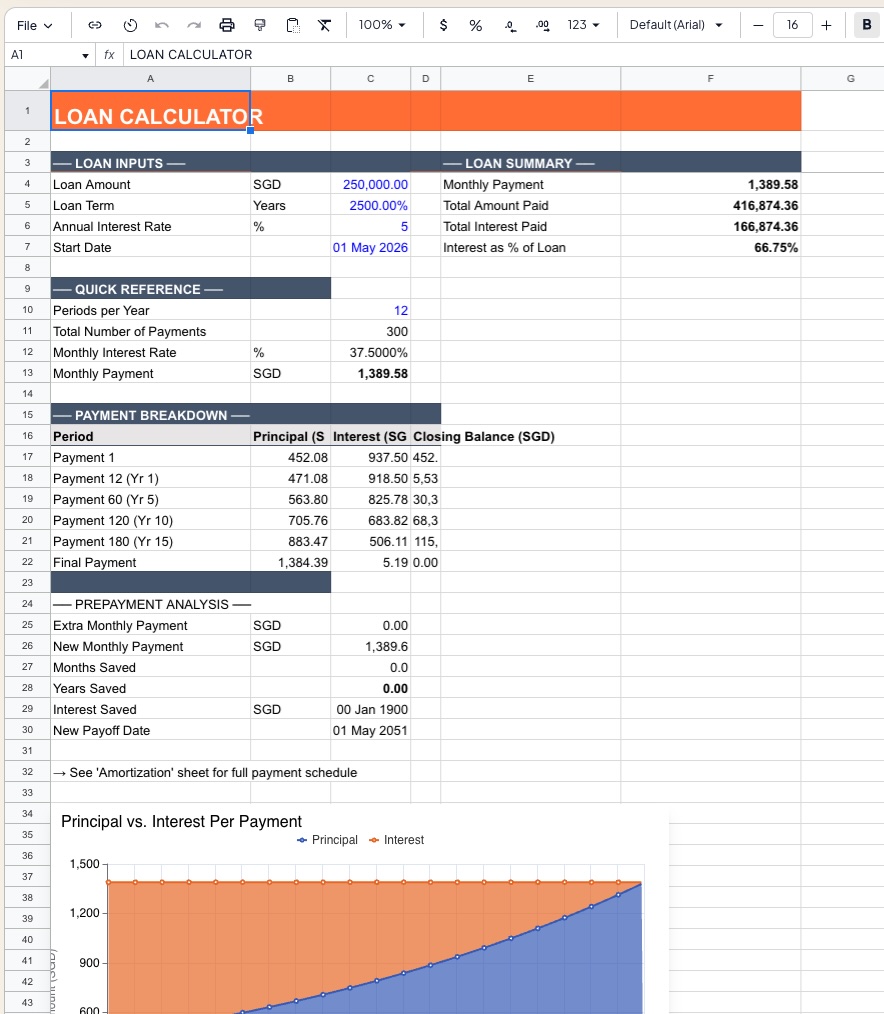
This Loan Calculator Template provides a complete picture of any fixed-rate installment loan — from monthly repayment amount to the last dollar of interest paid. Enter your loan parameters and instantly see a full amortization schedule, payment breakdown chart, and early repayment analysis. Designed to work for personal loans, car loans, business term loans, and mortgage-style financing alike.
Suitable for borrowers evaluating affordability before taking a loan, businesses modeling debt servicing costs, financial advisors illustrating loan structures to clients, and anyone comparing loan offers across different rates, terms, or repayment frequencies.
Model Architecture
The template is organized across 5 interconnected sheets:
| Sheet | Purpose |
|---|---|
Calculator | Primary input panel, repayment summary, and key metrics |
Amortization | Full period-by-period repayment schedule |
Comparison | Side-by-side comparison of up to 3 loan offers |
Prepayment | Impact of extra repayments on interest saved and loan term |
Summary | One-page visual dashboard with charts and key outputs |
Inputs
All parameters are entered in the Calculator sheet. Blue cells are editable; all other cells are formula-driven.
Loan Details
| Input | Example | Description |
|---|---|---|
| Loan Amount | $50,000 | Principal borrowed |
| Annual Interest Rate | 5.50% | Nominal annual rate quoted by lender |
| Loan Term | 5 years | Total repayment duration |
| Repayment Frequency | Monthly | Dropdown: Weekly, Fortnightly, Monthly |
| Loan Start Date | May 1, 2026 | First repayment date auto-calculated from this |
| Loan Type | Amortizing | Dropdown: Amortizing, Interest-Only, Balloon |
| Balloon Payment | — | Final lump sum due (balloon loans only) |
Fees & Charges (Optional)
| Input | Description |
|---|---|
| Establishment Fee | Upfront origination or processing fee |
| Annual Fee | Recurring yearly account-keeping fee |
| Early Repayment Fee | Penalty percentage if loan repaid ahead of schedule |
Repayment Summary
Instantly updated as inputs change:
| Output | Description |
|---|---|
| Regular Repayment Amount | Fixed installment per period (P&I) |
| Number of Repayments | Total count of payments over the loan term |
| Total Amount Repaid | Sum of all repayments (principal + interest) |
| Total Interest Paid | True cost of borrowing over the full term |
| Interest-to-Principal Ratio | Interest as a % of original loan amount |
| Effective Annual Rate (EAR) | True annualized cost including compounding frequency |
| Comparison Rate | EAR inclusive of fees — the all-in cost of the loan |
| Loan Payoff Date | Final repayment month and year |
Loan Type Reference
| Type | Description |
|---|---|
| Amortizing | Each payment covers interest + principal; balance reduces to zero at maturity |
| Interest-Only | Payments cover interest only for a set period; principal repaid at end or refinanced |
| Balloon | Reduced regular payments with a large lump sum due at the end of the term |
Amortization Schedule
A full period-by-period breakdown from first to final repayment:
| Column | Description |
|---|---|
| Period # | Repayment number (1 through n) |
| Payment Date | Calendar date of each installment |
| Opening Balance | Loan balance at start of period |
| Repayment | Fixed installment amount |
| Principal Component | Portion of repayment reducing the loan balance |
| Interest Component | Portion of repayment covering interest charges |
| Closing Balance | Remaining loan balance after payment |
| Cumulative Interest | Total interest paid from inception to date |
The front-loading of interest in early periods is clearly visible — in the first payment of a 5-year loan at 5.5%, the majority of the installment is interest. By the final payments, nearly the entire installment is principal.
Payment Breakdown Chart
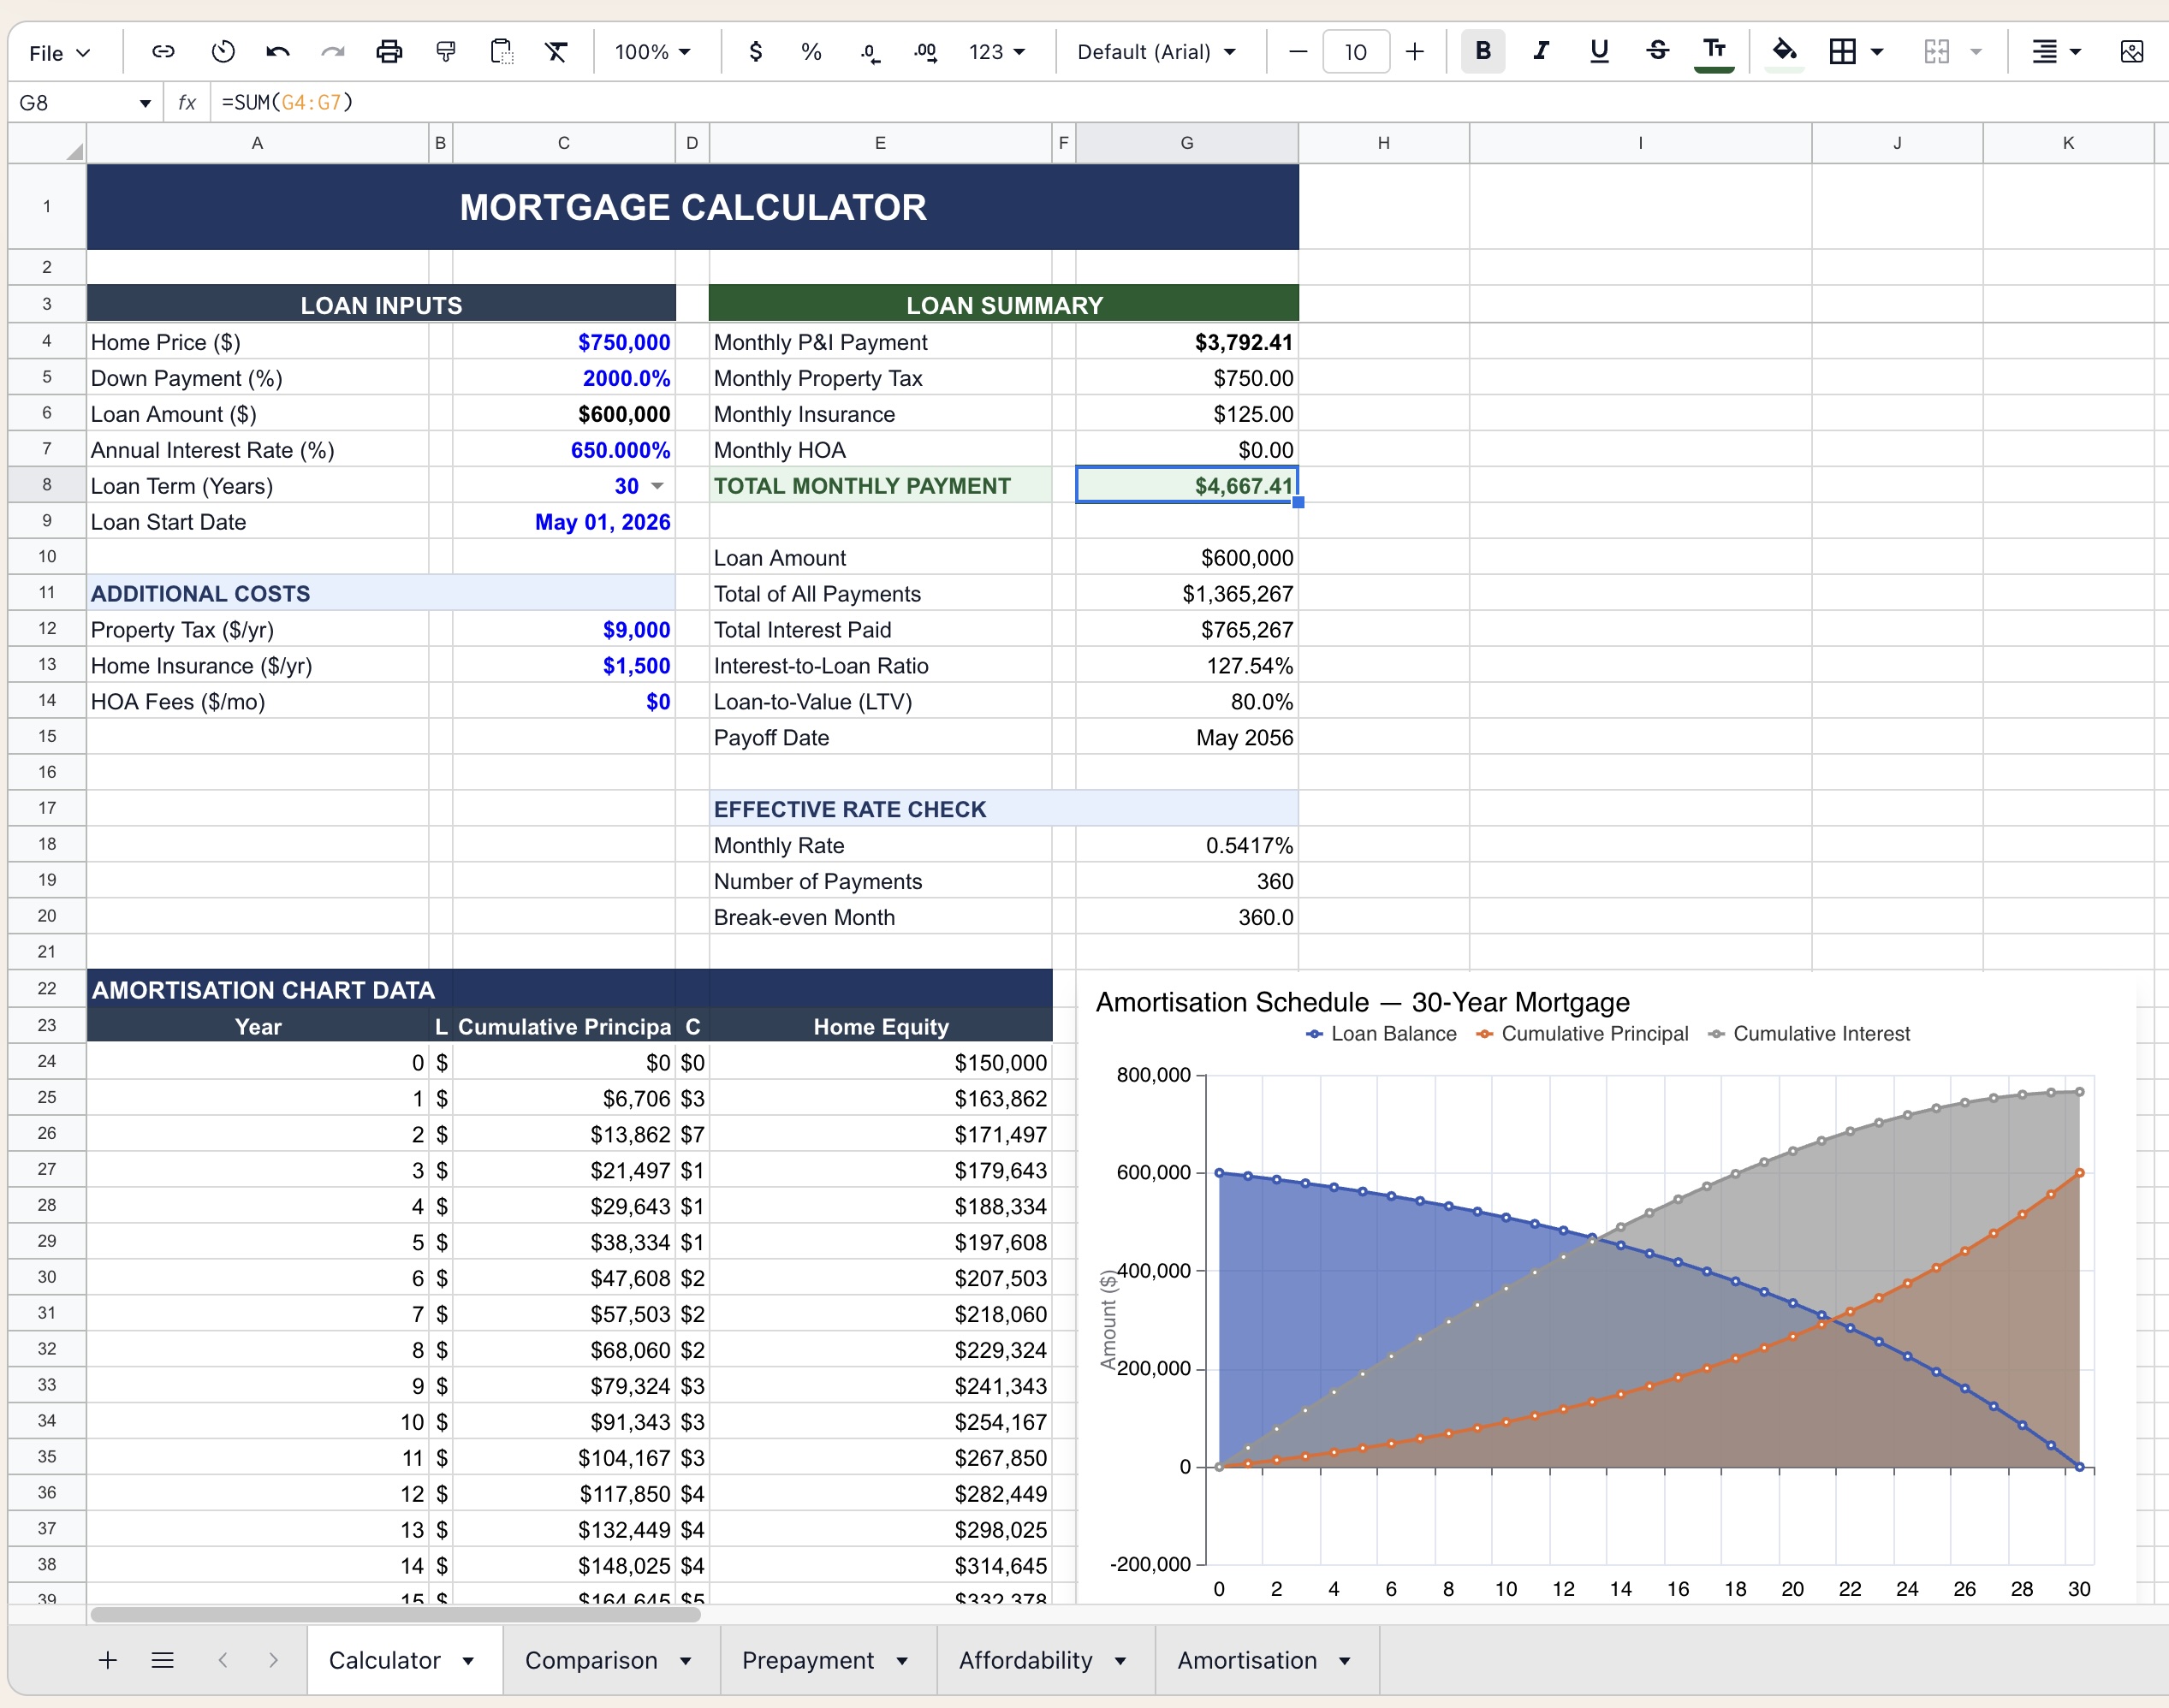
A stacked bar or area chart plotted across all repayment periods showing:
- Principal Component — growing share of each repayment over time
- Interest Component — shrinking share as the balance reduces
- Remaining Balance — declining curve overlaid on a secondary axis
The crossover point — where cumulative principal repaid exceeds cumulative interest paid — is automatically marked on the chart.
Comparison Sheet
Side-by-side evaluation of up to 3 loan offers:
| Output Compared | Description |
|---|---|
| Regular Repayment | Monthly / fortnightly installment |
| Total Interest Paid | Lifetime interest cost |
| Comparison Rate | All-in annualized cost including fees |
| Total Amount Repaid | Full lifetime cash outflow |
| Payoff Date | Final repayment date |
| Break-Even Month | When switching from Loan A to Loan B pays off |
Useful for comparing a lower rate with higher fees against a no-fee loan, or a 3-year term vs. a 5-year term at the same rate.
Prepayment Analysis
Models the impact of paying extra above the minimum repayment:
| Input | Description |
|---|---|
| Extra Monthly Repayment | Additional principal paid each period |
| One-Off Lump Sum | Single extra payment and the month it is made |
| Output | Description |
|---|---|
| Interest Saved | Total reduction in interest paid |
| Months Saved | Reduction in loan term |
| New Payoff Date | Earlier final repayment date |
| Break-Even Period | Month at which the extra repayment effort pays off |
A toggle allows switching between the original and accelerated schedules to compare the full amortization tables side by side.
Key Formula Reference
Regular Repayment (Amortizing Loan)
PMT = P × [r(1+r)^n] / [(1+r)^n − 1]
Interest Component of Any Payment
Interest = Opening Balance × Periodic Rate
Principal Component of Any Payment
Principal = PMT − Interest
Effective Annual Rate
EAR = (1 + r/n)^n − 1
Comparison Rate
Includes all fees annualized over the loan term alongside the nominal rate
Where P = Principal, r = Periodic Interest Rate, n = Total Number of Periods.
Formatting Conventions
- 🔵 Blue font — user-editable input cells
- ⚫ Black font — formula-driven outputs (do not edit)
- 🟢 Green shading — favorable outputs (surplus, interest saved)
- 🔴 Red shading — high interest cost warnings, balloon payment due flags
- Dark navy header bands — section titles throughout
- Currency defaults to SGD — configurable to USD, AUD, MYR, or any local currency
- All rates displayed to 2 decimal places; currency values with comma formatting
How to Use
- Enter Loan Amount, Annual Interest Rate, Loan Term, and Repayment Frequency in the Calculator sheet
- Select Loan Type from the dropdown (Amortizing, Interest-Only, or Balloon)
- Add any establishment or annual fees if applicable
- Review the Repayment Summary for monthly payment and total interest cost
- Check the Amortization sheet for the full period-by-period schedule
- Use the Comparison sheet to evaluate alternative loan offers
- Model extra repayments in the Prepayment sheet to see interest savings
- Export the Summary sheet to PDF for advisor review or personal records
Requirements
- Microsoft Excel 2016+ or Excel 365 (Windows or Mac)
- No macros required — fully formula-based
- Compatible with Google Sheets with minor chart adjustments
- Print-ready Summary sheet fits one A4 page
Limitations & Caveats
This template models fixed-rate loans only. Variable rate, split rate, and revolving credit facilities require additional modeling.
- Does not model variable or floating interest rates
- Fees modeled as simple inputs — complex fee structures (tiered, conditional) require customization
- Tax deductibility of interest (e.g. investment loans) is not calculated
- For Singapore-based users: MAS-regulated Total Debt Servicing Ratio (TDSR) and Mortgage Servicing Ratio (MSR) checks are not automated — apply separately
- Does not account for redraw facilities or offset account mechanics
Changelog
| Version | Date | Notes |
|---|---|---|
| v1.0 | Mar 2024 | Initial release — calculator and amortization schedule |
| v1.5 | Sep 2024 | Added comparison sheet, prepayment analysis, balloon loan type |
| v2.0 | Apr 2026 | Comparison rate output, fee modeling, Summary dashboard, chart redesign |