About Compound Interest Calculator
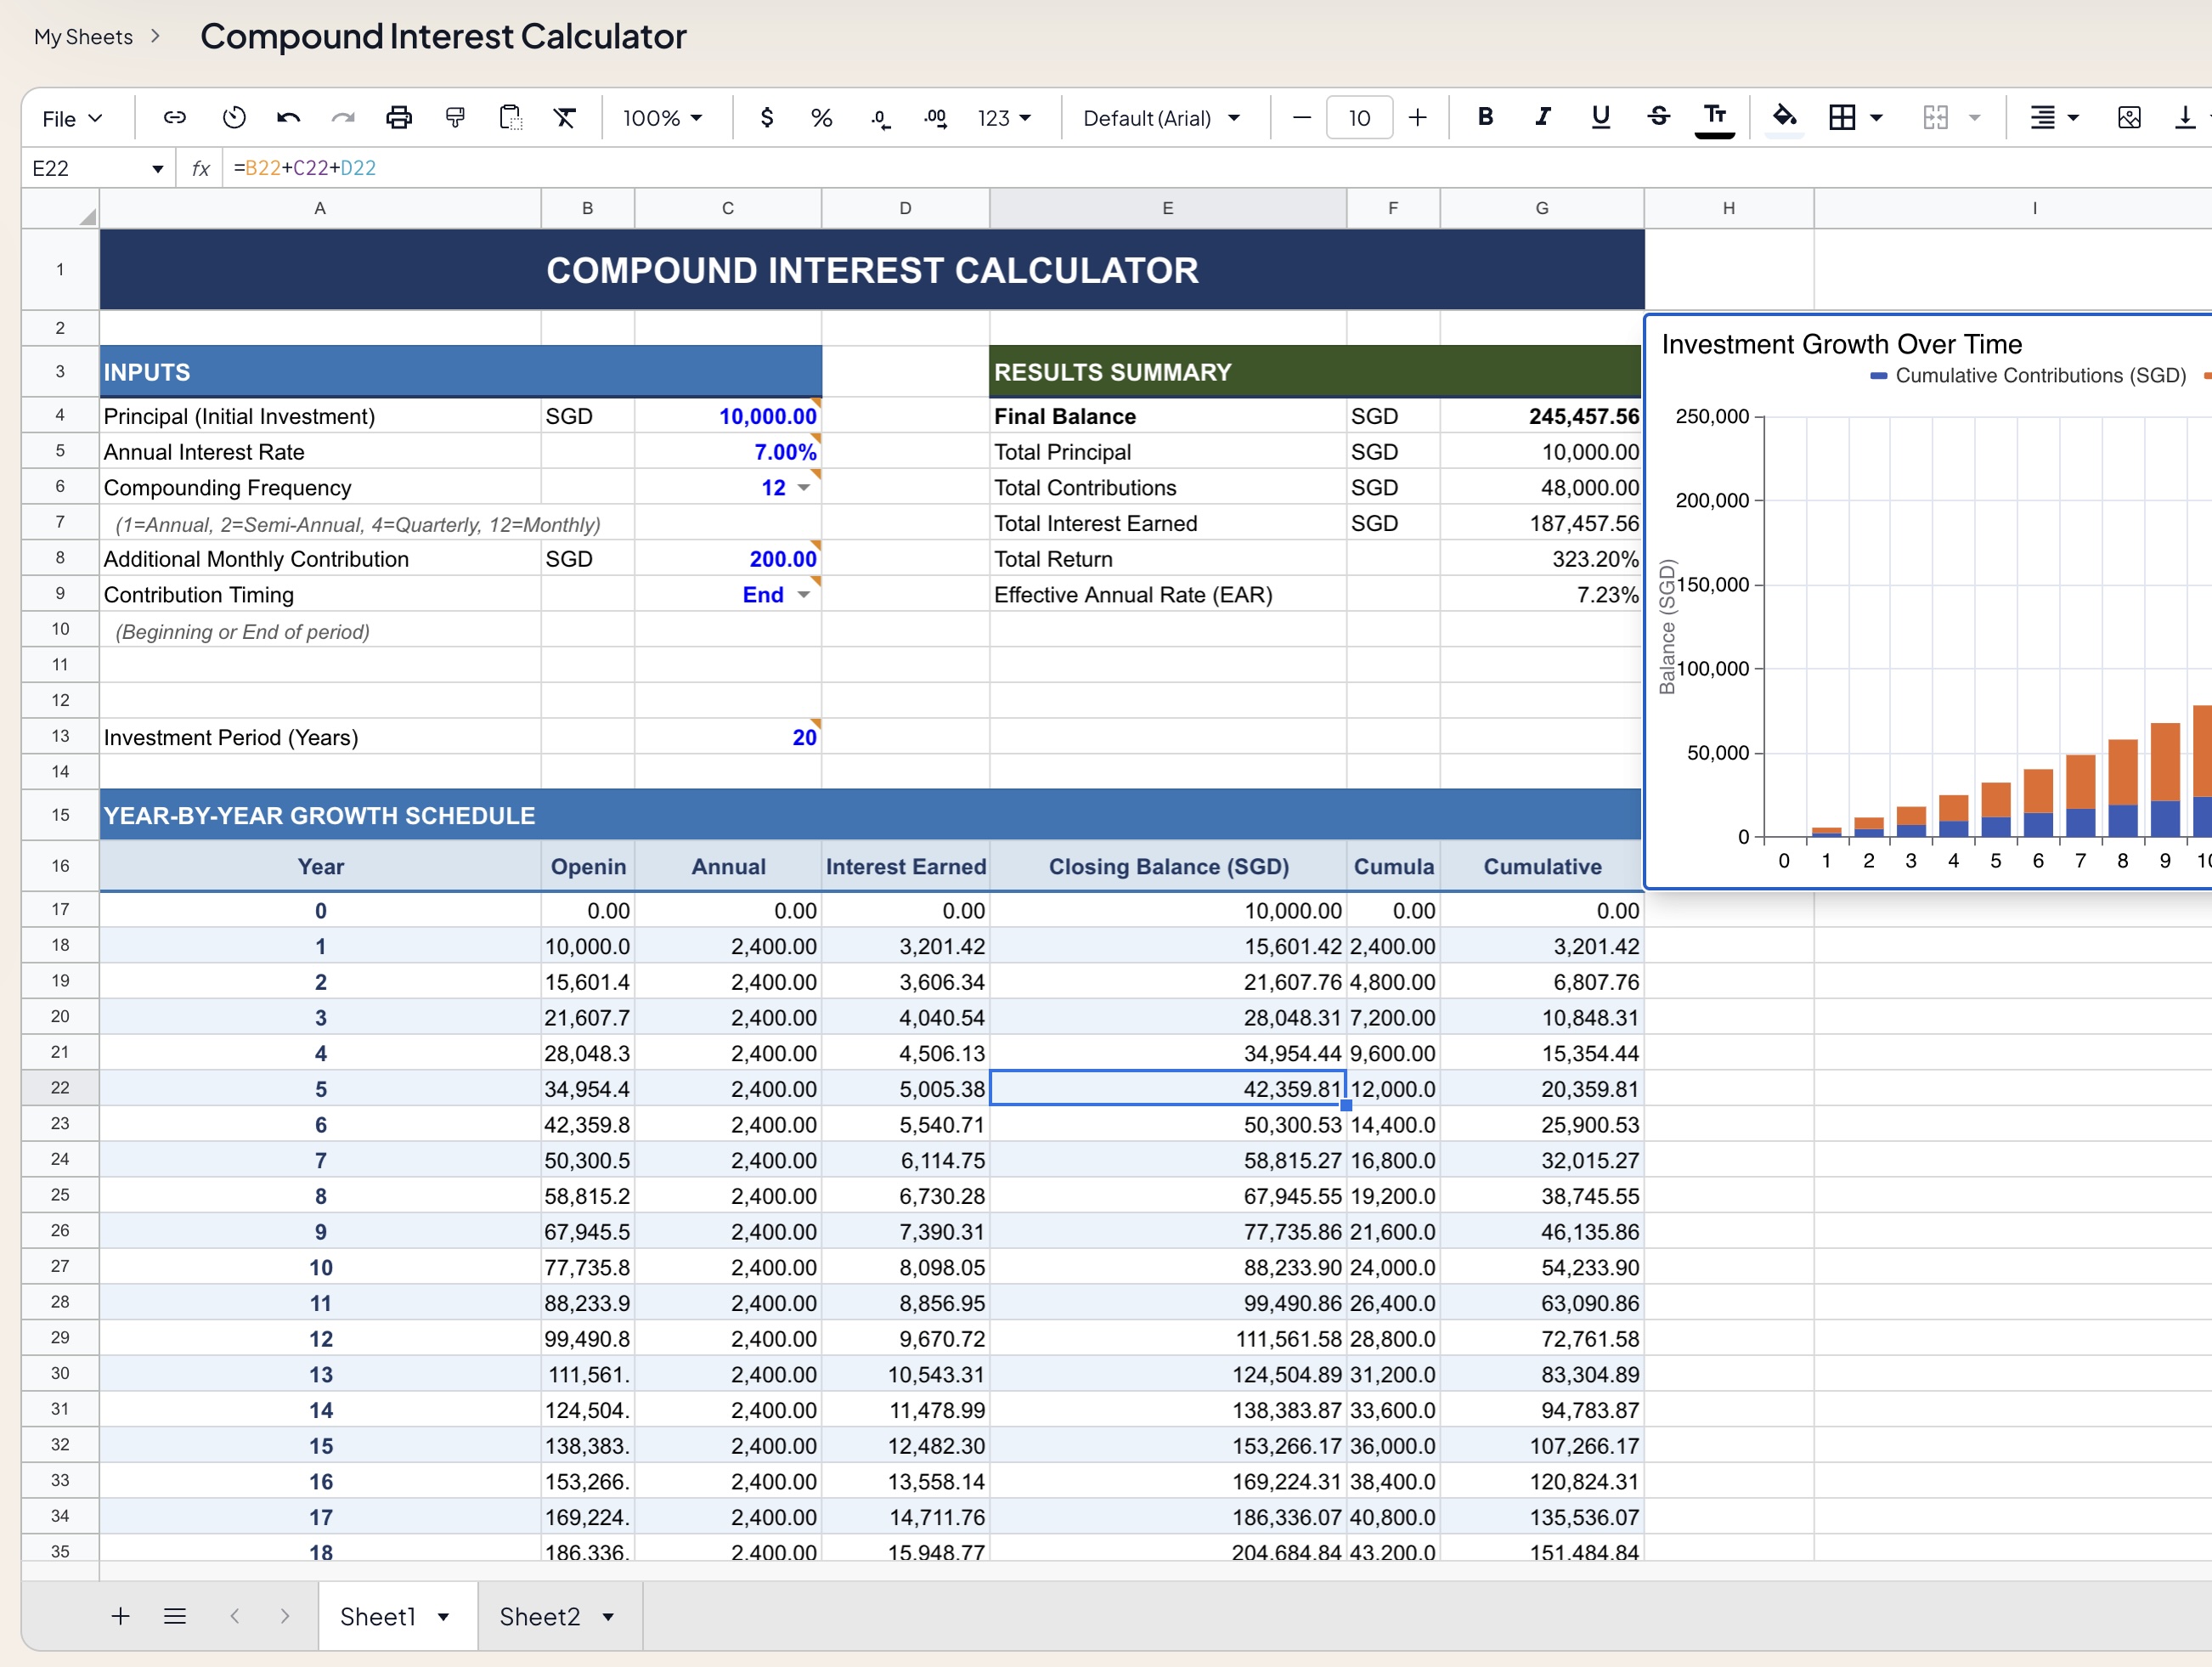
This Compound Interest Calculator models how an initial investment grows over time through the power of compounding, with support for regular additional contributions. Outputs include a full year-by-year growth schedule, a results summary panel, and an investment growth chart — giving a complete picture of wealth accumulation across any investment horizon.
Suitable for personal savings and retirement planning, education fund projections, fixed deposit and bond return modeling, and comparing contribution frequency or compounding period strategies.
Template Structure
| Section | Description |
|---|---|
Inputs | All user-defined parameters in one panel |
Results Summary | Key output metrics computed from inputs |
Year-by-Year Growth Schedule | Full annual breakdown of balance growth |
Investment Growth Chart | Stacked bar chart of principal vs. contributions vs. interest |
Inputs
All parameters are entered in the INPUTS panel. Blue cells are editable; all other cells are formula-driven.
| Input | Description |
|---|---|
| Principal (Initial Investment) | Starting lump sum invested on Day 0 |
| Annual Interest Rate | Nominal annual rate (e.g. 7.00%) |
| Compounding Frequency | Dropdown: 1=Annual, 2=Semi-Annual, 4=Quarterly, 12=Monthly |
| Additional Monthly Contribution | Regular top-up amount added each period |
| Contribution Timing | Dropdown: Beginning or End of period (affects interest earned) |
| Investment Period (Years) | Total duration of the investment horizon |
| Currency | Configurable — defaults to SGD |
Results Summary
Instantly updated as inputs change:
| Output | Description |
|---|---|
| Final Balance | Total portfolio value at end of investment period |
| Total Principal | Original lump sum invested |
| Total Contributions | Sum of all additional periodic contributions |
| Total Interest Earned | Compounded interest generated over the full period |
| Total Return | Percentage gain on total capital deployed |
| Effective Annual Rate (EAR) | True annualized return accounting for compounding frequency |
Year-by-Year Growth Schedule
A full annual table from Year 0 through the end of the investment period:
| Column | Description |
|---|---|
| Year | Year number (0 = inception) |
| Opening Balance | Portfolio value at start of year |
| Annual Contributions | Total additional contributions made during the year |
| Interest Earned | Compounded interest credited during the year |
| Closing Balance | Portfolio value at end of year |
| Cumulative Contributions | Total contributions made from inception to date |
| Cumulative Interest | Total interest earned from inception to date |
The exponential acceleration of interest earned in later years visually demonstrates the compounding effect — interest earned in Year 18 can dwarf that of Year 1 on the same contribution rate.
Investment Growth Chart
A stacked bar chart plotted year-by-year showing three components of the closing balance:
- Principal — the original lump sum (constant base)
- Cumulative Contributions — additional deposits stacked above principal
- Cumulative Interest — compounded growth stacked on top
The widening gap between the contributions bar and the total balance bar illustrates the accelerating power of compounding — particularly visible in the later years of a 20+ year horizon.
Compounding Frequency Reference
| Dropdown Value | Frequency | Periods per Year |
|---|---|---|
| 1 | Annual | 1 |
| 2 | Semi-Annual | 2 |
| 4 | Quarterly | 4 |
| 12 | Monthly | 12 |
Higher compounding frequency increases the Effective Annual Rate (EAR) above the nominal rate. For example, a 7.00% nominal rate compounded monthly yields an EAR of 7.23%.
Key Formula Reference
Compound Interest (no contributions)
FV = P × (1 + r/n)^(n×t)
Future Value with Regular Contributions (end of period)
FV = P × (1 + r/n)^(n×t) + PMT × [((1 + r/n)^(n×t) − 1) / (r/n)]
Effective Annual Rate
EAR = (1 + r/n)^n − 1
Where P = Principal, r = Annual Rate, n = Compounding Frequency, t = Years, PMT = Periodic Contribution.
Formatting Conventions
- 🔵 Blue font — user-editable input cells
- ⚫ Black font — formula-driven outputs (do not edit)
- Dark navy header bands — section titles (Inputs, Results Summary, Growth Schedule)
- Dark green header band — Results Summary panel
- Currency label displayed alongside each monetary input and output
- Percentage values formatted to 2 decimal places
Requirements
- Microsoft Excel 2016+ or Excel 365 (Windows or Mac)
- No macros required — fully formula-based
- Compatible with Google Sheets with minor chart adjustments
- Sheet2 available for extended schedule or scenario comparison
Limitations & Caveats
Returns are modeled at a fixed nominal rate. Real-world investments fluctuate — this calculator assumes a constant compounding rate throughout the investment period.
- Does not model variable or step-up contribution amounts
- Tax on interest income is not deducted from returns
- Inflation adjustment not included — all values are nominal
- Does not account for fees, fund expense ratios, or bid-ask spreads
Changelog
| Version | Date | Notes |
|---|---|---|
| v1.0 | Feb 2024 | Initial release — basic compound interest with chart |
| v1.5 | Aug 2024 | Added monthly contributions, contribution timing toggle |
| v2.0 | Apr 2026 | EAR output, SGD currency label, Sheet2 for scenario comparison |